


Anyone who's worked with PySpark knows how frustrating it is when an application crashes due to lack of memory. You're there, processing data peacefully, when suddenly everything stops and that error message no one wants to see appears. It turns out that memory management in PySpark can reduce resource consumption by up to 2x when you know what you're doing.
Until recently, figuring out memory issues in distributed PySpark applications was like looking for a needle in a haystack, especially when the problem was in the Spark executors. You were left guessing which part of the code was consuming all the available memory.
Fortunately, since Databricks Runtime 12.0, this headache has been greatly reduced with the arrival of memory analysis tools directly on the executors.
Today, we have access to memory profiling tools that show exactly which lines of code in your UDFs are hogging resources. This completely changes how we can make the necessary improvements.
There is also Adaptive Query Execution, known as AQE, which came with Spark 3.x and helps improve query execution plans while they are running, using the statistics it collects.
The question remains: how can we use these tools in a practical way to improve the performance of our notebooks in Databricks?
We'll see how to better organize your data layout, how to manage shuffles without breaking everything, how to solve those annoying skew issues, and how to use cache in a way that really makes a difference in your application's performance.
Organize Data and Write Better in Delta Tables
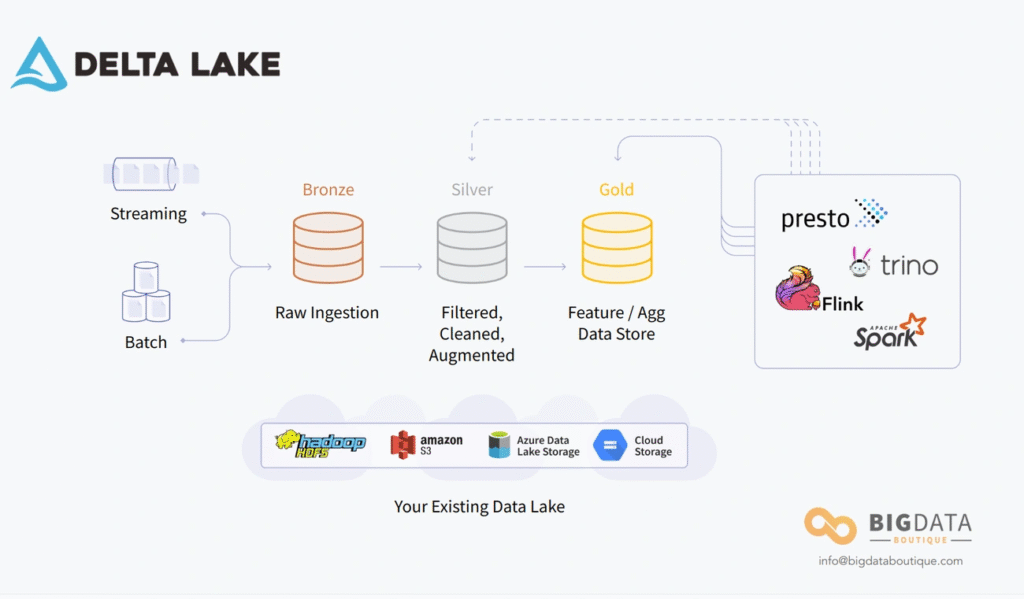
You've probably experienced that situation where a query that should be fast ends up taking forever. Often the culprit is "small files" in Delta Lake. When you're writing data frequently, especially in streams or batch updates, thousands of small files end up creating a mess in the metadata and slowing down your queries.
Fortunately, Databricks has some very useful features to solve this data layout issue in Delta tables.
delta.autoOptimize.optimizeWrite and delta.autoOptimize.autoCompact
There is a feature called optimizeWrite which reduces the number of files written, making each file larger during write operations. The idea is simple: it takes several small writes to the same partition and combines them into a single operation before executing, creating larger, more efficient files.
To enable this functionality, you have two options:
- At the table level:
delta.autoOptimize.optimizeWrite = true - At the session level:
spark.databricks.delta.optimizeWrite.enabled = true
THE autoCompact It works as a plugin, automatically running a small optimize command after each write operation. Basically, it takes data from files that are under a certain size and merges it into a larger file, immediately after the write completes successfully.
Settings delta.targetFileSize for file size control
To adjust the size of the files in your Delta tables, you can configure the property delta.targetFileSize with the size that makes the most sense. Once you set this property, all layout optimization operations will do their best to generate files of the specified size.
Databricks itself automatically adjusts the file size based on the table size:
- For tables smaller than 2.56 TB: 256 MB
- For tables between 2.56 TB and 10 TB: grows linearly from 256 MB to 1 GB
- For tables larger than 10 TB: 1 GB
Use ZORDER to keep related data in the same place
Z-Ordering is an interesting technique that places related information in the same set of files. This organization is automatically used by Delta Lake's data-skipping algorithms, drastically reducing the amount of data that needs to be read during queries.
To apply Z-Ordering, you specify the columns in the OPTIMIZE command:
OPTIMIZE events WHERE date >= current_timestamp() - INTERVAL 1 day ZORDER BY (eventType)This technique works well for columns you frequently use in filters and that have high cardinality, meaning many different values. You can even specify multiple columns for ZORDER BY by separating them with commas, but the effectiveness decreases as you add more columns.
Shuffles and Partitions: How to Prevent Data Spills

Image Source: LinkedIn
Shuffle in PySpark is one of those things that can completely destroy your application's performance. Whenever you perform joins, aggregations, or sorts, Spark needs to reorganize the data across the cluster's nodes. When this isn't done correctly, data starts spilling to disk, slowing everything down.
spark.sql.shuffle.partitions: adjusting by hand according to data volume
Spark is configured by default to use 200 partitions during shuffle operationsThis number is almost never ideal for what you're doing. If you use too few partitions, each task will process too much data and can overflow memory, causing that annoying spill to disk. On the other hand, if you use too many partitions, you end up creating very small tasks that spend more time on overhead than processing data.
To adjust this:
spark.conf.set("spark.sql.shuffle.partitions", 50) # Example for 5GB of data on a 10-core clusterThere's a rule of thumb that works well: each task should process between 128MB and 200MB of data. You can calculate the ideal number of partitions by dividing the total volume of data that will be shuffled by this value. Another option is to set it to 2 to 3 times the total number of CPU cores you have available.
spark.sql.adaptive.autoOptimizeShuffle.preshufflePartitionSizeInBytes
Databricks has created a feature called Auto-Optimized Shuffle (AOS) that automatically tries to figure out the optimal number of partitions:
spark.conf.set("spark.databricks.adaptive.autoOptimizeShuffle.enabled", "true")However, this functionality has its limitations. When you work with tables that have exceptionally high compression ratios (20x to 40x), AOS can make a serious mistake in estimating the number of partitions needed.
AQE for automatic adjustment of shuffle partitions
Adaptive Query Execution is enabled by default since Apache Spark 3.2.0 and one of the most useful things it does is dynamically adjust the number of shuffle partitions.
To configure AQE:
spark.conf.set("spark.sql.adaptive.enabled", "true") spark.conf.set("spark.sql.adaptive.coalescePartitions.enabled", "true") spark.conf.set("spark.sql.adaptive.advisoryPartitionSizeInBytes", "67108864") # 64MBWhat happens is that AQE analyzes the actual data size after the shuffle and adjusts the number of partitions on the fly. Imagine you have a 10GB DataFrame with 200 original partitions—AQE can dynamically shrink it to 50 well-balanced partitions during runtime, improving performance without you having to do anything.
AQE can also split skewed partitions into smaller chunks, avoiding bottlenecks that cause one task to take much longer than the others and cause spillage. This is especially valuable when you're working with data with unpredictable characteristics.
Identify and Correct Skew and Data Explosion

Image Source: VLink Inc.
One of the most annoying things about distributed processing is data skew. This is where data becomes unbalanced across Spark partitions, causing some tasks to process much more data than others.
You might be there, thinking everything is going smoothly, when suddenly one task takes forever to finish while the others are long gone.
How to find skew using Spark UI
Spark UI has become my best friend for tracking down these issues. When you suspect skew, you go straight to:
- In the tab Stages, those tasks that take much longer than average
- The metrics of Summary Metrics where you see huge differences between the percentiles
- A partition is already considered problematic when it is greater than 5 times the median and exceeds 256MB
The tip is to keep an eye on skewness metrics to identify bottlenecks. When the distribution is healthy, the values are similar across all percentiles. But when there's skew, you see a dramatic difference between the 75th percentile and the maximum value.
Resolve skew with hints and salting
Since Spark 3.0, AQE can automatically handle joins that have skew when you put spark.sql.adaptive.enabled=true and spark.sql.adaptive.skewJoin.enabled=true.
But there are cases he can't solve alone. Then you need to intervene:
- Use explicit skew hints to warn Spark about problematic columns
- Apply the “salting” technique – which basically adds a bit of randomness to the keys:
df_salted = df.withColumn("salt", (rand() * 10).cast("int")) df_salted = df_salted.withColumn("salted_key", col("key") + col("salt"))Salting works by redistributing data more evenly, preventing some resources from becoming overloaded.
Explode() and joins: the villains of the data explosion
There are two operations that are champions in making data explode:
- explode(): takes columns that are collections and transforms them into individual rows, multiplying the volume of data
- joins: especially when they produce many more rows than you expected (you can check this in the SortMergeJoin node in the Spark UI)
I've seen 128MB partitions turn into gigabytes because of these explosions, and then the available memory can't handle it.
Use repartitioning to control explosions
When you're dealing with data explosions, a few strategies can save the day:
- Decrease the
spark.sql.files.maxPartitionBytesfrom 128MB to 16MB or 32MB - To execute
repartition()right after reading the data - For explosions that occur in joins, increase the number of shuffle partitions
These techniques can prevent data from being flushed to disk and greatly improve memory management when you're processing large volumes.
Cache and Persistence: How to Really Gain Performance
Caching is one of those things everyone talks about as important, but in practice, many people don't quite know when and how to use it. It turns out that caching data can make a huge difference in PySpark's memory management, especially when you need to reuse the same data multiple times.
Databricks Delta Cache: The Cache That Runs Itself
Databricks' disk cache, formerly known as Delta Cache, is a feature that significantly speeds up data reads. It creates local copies of your Parquet files using an optimized intermediate format. The cool thing is that this feature is automatically enabled on nodes with SSD volumes, and it uses a maximum half the available space on these devices.
To check if it is working or to change the settings:
# View how it is configured spark.conf.get("spark.databricks.io.cache.enabled") # Turn the cache on or off spark.conf.set("spark.databricks.io.cache.enabled", "true")One interesting thing about this disk cache is that it automatically detects when files change, so you don't have to worry about manually invalidating the cache. This is quite different from Apache Spark's default cache.
How to use cache() and persist() without breaking everything
While Delta Cache takes care of the files, the cache() and persist() are to improve performance when you are going to use the same DataFrame multiple times:
# Basic Cache (uses MEMORY_AND_DISK by default) df.cache() # Persist with more control over where to store it df.persist(storageLevel=StorageLevel.MEMORY_ONLY)Here's an important catch: these two operations are lazy evaluation operations, meaning they will only execute when you call an action. If you want caching to happen immediately, you need to force it:
df.persist() df.count() # This forces the cache to be materializedTemporary views or tables? It depends on what you want
Temporary views are virtual, so every time you access them, the query runs again. Temporary tables, on the other hand, materialize the results. The choice depends on your situation:
- Temporary views: when it is something simple or that you will only use once
- Temporary tables: for heavy transformations that you will access multiple times
There's an interesting strategy for computationally expensive operations that you'll access frequently. You can create a temporary view and then cache it:
dataframe.createOrReplaceTempView("view_name") spark.sql("CACHE TABLE view_name")This approach combines the best of both worlds: the flexibility of views with the performance benefits of caching.
Conclusion
After exploring all these memory management techniques in PySpark, it's clear that there's no magic solution that solves everything at once. Each problem has its own unique characteristics and requires a specific approach.
The memory analysis tools introduced with Databricks Runtime 12.0 have truly changed the game. While it used to be very difficult to understand where the bottlenecks were, now we can see exactly which lines of code are consuming the most resources. This makes it much easier to make the necessary improvements.
We've seen how data layout in Delta tables can make a huge difference in performance. optimizeWrite and autoCompact solve that annoying problem of small files, while ZORDER is a great help when you need to query specific data frequently.
Shuffles and partitions remain one of the most important aspects of preventing data from being spilled to disk. AQE helps a lot with this, but we still need to understand our data and adjust settings as needed.
It's important to note that skew and data explosion issues can arise in unexpected ways, especially when working with large volumes. Knowing how to identify these issues in Spark UI and having salting techniques up your sleeve makes all the difference.
Caching strategies, both Delta Cache and persist() on DataFrames, complete this toolkit. When used correctly, they eliminate a lot of unnecessary reprocessing and save resources.
However, all of these techniques are now part of the daily lives of those who work with big data, and we somehow need to constantly adapt as our data and workloads evolve.
The important thing to remember is that memory optimization isn't something you do once and forget about. It's an ongoing process that needs to keep pace with your data growth and the evolution of your applications. Each new project brings its own challenges, and having these tools well-understood makes it much easier to address bottlenecks that arise along the way.
For those who want to delve deeper into this world of large-scale data processing, it's worth continuing to study and practice these techniques in real-world scenarios. Practical experience is what truly solidifies this knowledge.
FAQs
Q1. How does Adaptive Query Execution (AQE) improve performance in PySpark? AQE optimizes queries during execution by dynamically adjusting the number of shuffle partitions and splitting skewed partitions. This results in better resource utilization and reduced performance bottlenecks.
Q2. What are the best practices to avoid the “small files” issue in Delta Lake? Leverage features like optimizeWrite and autoCompact, adjust delta.targetFileSize, and apply ZORDER to frequently filtered columns. These techniques optimize data layout, improving query performance.
Q3. How to identify and fix data skew issues in Spark? Analyze the Spark UI to identify tasks that take longer than average and use shuffle metrics. To fix this, use skew hints, implement salting, or leverage AQE to automatically manage skewed joins.
Q4. What is the difference between Databricks disk cache and Apache Spark cache? Databricks' disk cache (Delta Cache) optimizes reading of Parquet files by automatically detecting changes. Spark's cache (cache() and persist()) improves the performance of repeated transformations on DataFrames.
Q5. When should I use temporary views instead of intermediate tables in Spark? Use temporary views for simple queries or single-use, and temporary tables for complex transformations or multiple accesses. For expensive and frequent operations, consider creating a temporary view with caching to combine flexibility and performance.
References
[1] – https://www.databricks.com/discover/pages/optimize-data-workloads-guide
[2] – https://www.databricks.com/blog/2022/11/30/memory-profiling-pyspark.html
[3] – https://blog.dataengineerthings.org/a-quick-guide-to-spark-and-databricks-optimization-engines-1d2089185cf2
[4] – https://learn.microsoft.com/en-us/azure/synapse-analytics/spark/optimize-write-for-apache-spark
[5] – https://delta.io/blog/delta-lake-optimize/
[6] – https://docs.databricks.com/aws/en/delta/tune-file-size
[7] – https://docs.databricks.com/aws/en/delta/data-skipping
[8] – https://community.databricks.com/t5/data-engineering/what-is-z-ordering-in-delta-and-what-are-some-best-practices-on/td-p/26639
[9] – https://www.databricks.com/blog/2020/10/21/faster-sql-adaptive-query-execution-in-databricks.html
[10] – https://www.sparkcodehub.com/pyspark/performance/shuffle-optimization
[11] – https://spark.apache.org/docs/3.5.0/sql-performance-tuning.html
[12] – https://www.databricks.com/notebooks/gallery/SparkAdaptiveQueryExecution.html
[13] – https://docs.aws.amazon.com/emr/latest/ReleaseGuide/emr-spark-performance.html
[14] – https://aws.amazon.com/blogs/big-data/detect-and-handle-data-skew-on-aws-glue/
[15] – https://www.linkedin.com/pulse/what-data-skewness-spark-how-handle-code-soutir-sen-xf6hf
[16] – https://docs.aws.amazon.com/prescriptive-guidance/latest/tuning-aws-glue-for-apache-spark/optimize-shuffles.html
[17] – https://spark.apache.org/docs/latest/sql-performance-tuning.html
[18] – https://spark.apache.org/docs/3.5.3/sql-performance-tuning.html
[19] – https://www.linkedin.com/pulse/handling-data-skewness-spark-power-salting-pyspark-kommanaboina-vskic
[20] – https://docs.databricks.com/aws/en/optimizations/disk-cache
[21] – https://learn.microsoft.com/pt-br/azure/databricks/optimizations/disk-cache
[22] – https://sparkbyexamples.com/pyspark/pyspark-cache-explained/
[23] – https://community.databricks.com/t5/data-engineering/temp-table-vs-temp-view-vs-temp-table-function-which-one-is/td-p/4087
[24] – https://www.chaosgenius.io/blog/databricks-temporary-table/
[25] – https://stackoverflow.com/questions/50716772/spark-tempview-performance